Why Patterns Matter More Than High and Low Markers
For many practitioners, the value of better blood work interpretation becomes obvious during a real client case.
Not during a webinar.
Not while reading a list of software features.
But while reviewing a long lab report and realizing how much mental energy goes into making sense of it all.
Marker by marker.
Range by range.
System by system.
You are not just looking for what is high or low.
You are asking:
What matters most?
Which markers are connected?
Are several systems telling the same story?
How do I explain this clearly to the client?
How do I keep the conversation educational, non diagnostic, and within scope?
That is why meaningful blood work interpretation is about far more than reading numbers.
It is about context.
Blood Work Is Not Just a List of Individual Markers
One isolated marker rarely tells the whole story.
A client may have fatigue, brain fog, poor sleep, digestive discomfort, low energy, poor recovery, or ongoing symptoms even when several markers appear within the lab reference range.
That does not automatically mean something serious is being missed.
But it does show why interpretation requires a broader view.
The body does not function in isolated categories.
- Glucose regulation can influence inflammation.
- Inflammation can affect thyroid conversion.
- Nutrient status can impact energy production.
- Stress physiology can influence immune function
- Liver, kidney, and protein markers can shift how the rest of the report is understood.
When each marker is reviewed separately, these relationships are easier to miss.
But when blood work is organized by systems and patterns, the bigger picture becomes easier to see.
The Hidden Work Behind Blood Work Interpretation
Many people assume practitioners can glance at a lab report and immediately know what is happening.
In reality, thoughtful interpretation requires organization, prioritization, and clinical reasoning.
Practitioners are often thinking through questions like:
- Which findings deserve closer attention?
- Are multiple markers pointing in the same direction?
- Are there patterns across glucose regulation, thyroid function, immune activity, nutrient status, or inflammation?
- Has anything changed compared with the client’s previous blood work?
- How can this be explained clearly without overwhelming the client?
- How can the interpretation stay educational and within scope?
That is a lot to hold in your head while also preparing for a productive client conversation.
This is why blood work interpretation takes time.
Not because practitioners do not know what they are doing.
Because meaningful interpretation requires connecting patterns, not just reading numbers.
Why System Based Organization Makes Interpretation Easier
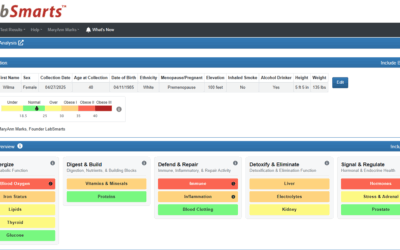
One of the most helpful shifts in blood work analysis is moving away from scattered markers and toward system based organization.
Instead of reviewing a report as a long list of disconnected values, system based interpretation groups markers into meaningful categories.
Glucose Regulation Markers related to blood sugar balance, insulin response, and metabolic stress.
Thyroid Function Markers connected to metabolism, energy, hormone signaling, thyroid production, conversion, transport, and utilization.
Immune Activity Patterns that may reflect immune stress, recovery demands, inflammatory activity, or nutrient related immune support needs.
Nutrient Status Markers that may reflect protein status, mineral balance, vitamin patterns, and overall nutritional support.
Liver and Kidney Health Markers that help practitioners evaluate major filtration, detoxification, protein, fluid, and metabolic systems.
Inflammation and Oxidative Stress Patterns that may help explain why a client feels depleted, inflamed, slow to recover, or not fully resilient.
When lab data is organized this way, interpretation becomes clearer.
You can see relationships faster.
You can prioritize more easily.
You can explain the findings with more confidence.
You can help clients understand what their blood work may be showing without turning the conversation into a confusing list of numbers.
Why “Normal” Does Not Always Feel Normal
One reason clients are increasingly interested in blood work is because they do not always feel reflected by the word “normal.”
They may hear:
“Your labs look fine.”
But they still feel off.
They may still be experiencing fatigue, brain fog, low motivation, digestive discomfort, poor recovery, mood shifts, or difficulty concentrating.
This does not mean a diagnosis should be assumed from blood work.
But it does highlight an important point:
Blood work patterns are often more nuanced than a single flagged marker.
A marker can be inside the standard lab range and still be part of a larger pattern worth discussing.
That is why many practitioners look beyond standard high and low flags and consider trends, relationships, optimal ranges, client context, and system patterns.
The goal is not to create fear.
The goal is to create clarity.
The Goal Is Clearer Client Communication
Good blood work interpretation should not make clients feel overwhelmed or alarmed.
It should help them understand what their body may be communicating.
The goal is to make the information:
- Clearer
- More organized
- More actionable
- Easier to explain
- Easier for the client to understand
This is where visual blood work reports can make a major difference.
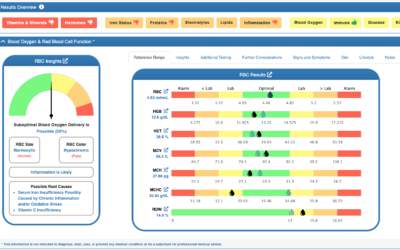
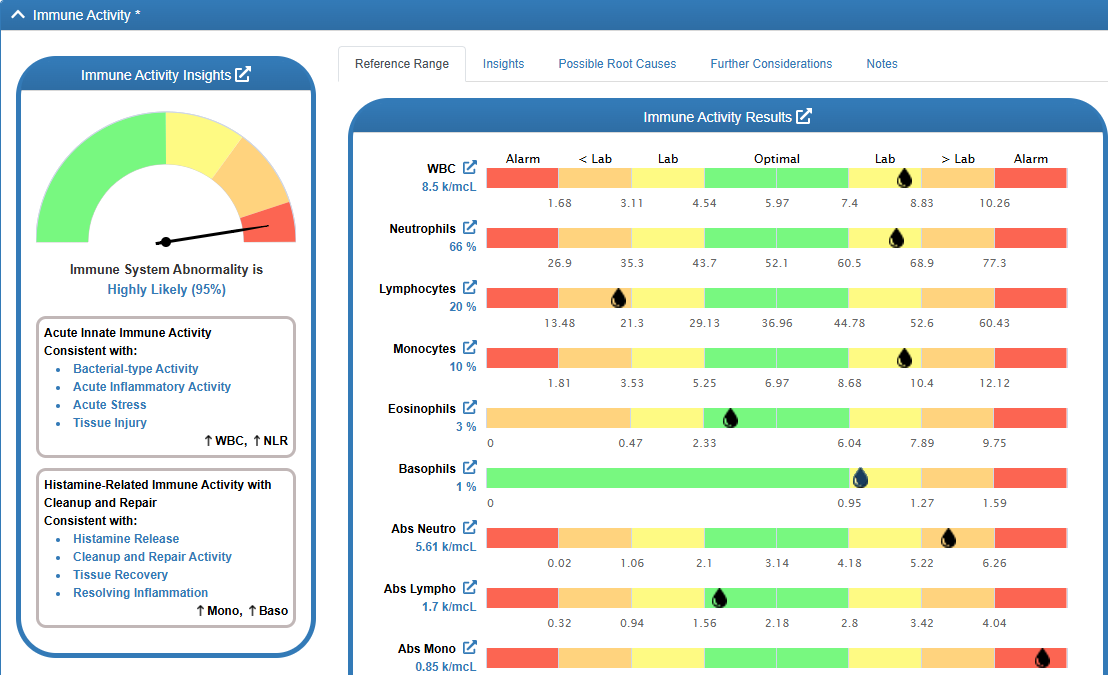
When clients can see their results organized by system, color-coded ranges, directional changes, and pattern-based insights, the conversation becomes easier.
Instead of trying to explain a long list of values, practitioners can walk clients through the bigger picture.
That changes the experience for both the practitioner and the client.
The Difference Practitioners Notice
For many practitioners, the shift happens when they compare manual interpretation to a more organized, visual workflow.
Instead of spending excessive time scanning disconnected numbers, they can focus on what matters most:
- Identifying patterns
- Connecting systems
- Educating clients
- Explaining findings clearly
- Supporting next step conversations
That is when blood work analysis stops feeling like scattered data and starts feeling like a story that makes sense.
And that is the reason LabSmarts was created.
LabSmarts helps practitioners organize blood work into visual, system based sections with bio individual reference ranges and pattern based insights, so interpretation becomes more efficient and client communication becomes clearer.
Blood Work Interpretation Is About the Bigger Picture
Blood work interpretation is not just about finding what is high or low.
It is about understanding patterns, context, relationships, and the bigger picture behind how a client feels.
When blood work is organized visually and systemically, practitioners can interpret more efficiently, explain findings more clearly, and help clients better understand their own health journey.
Sometimes the biggest shift is not having more information.
It is finally being able to see the information clearly.
Want to see how this looks with real blood work?