Blood Work Interpretation: How to Help Clients Understand Their Lab Results
Most practitioners know how to interpret labs.
The harder part is explaining those results in a way the person sitting across from you can actually understand.
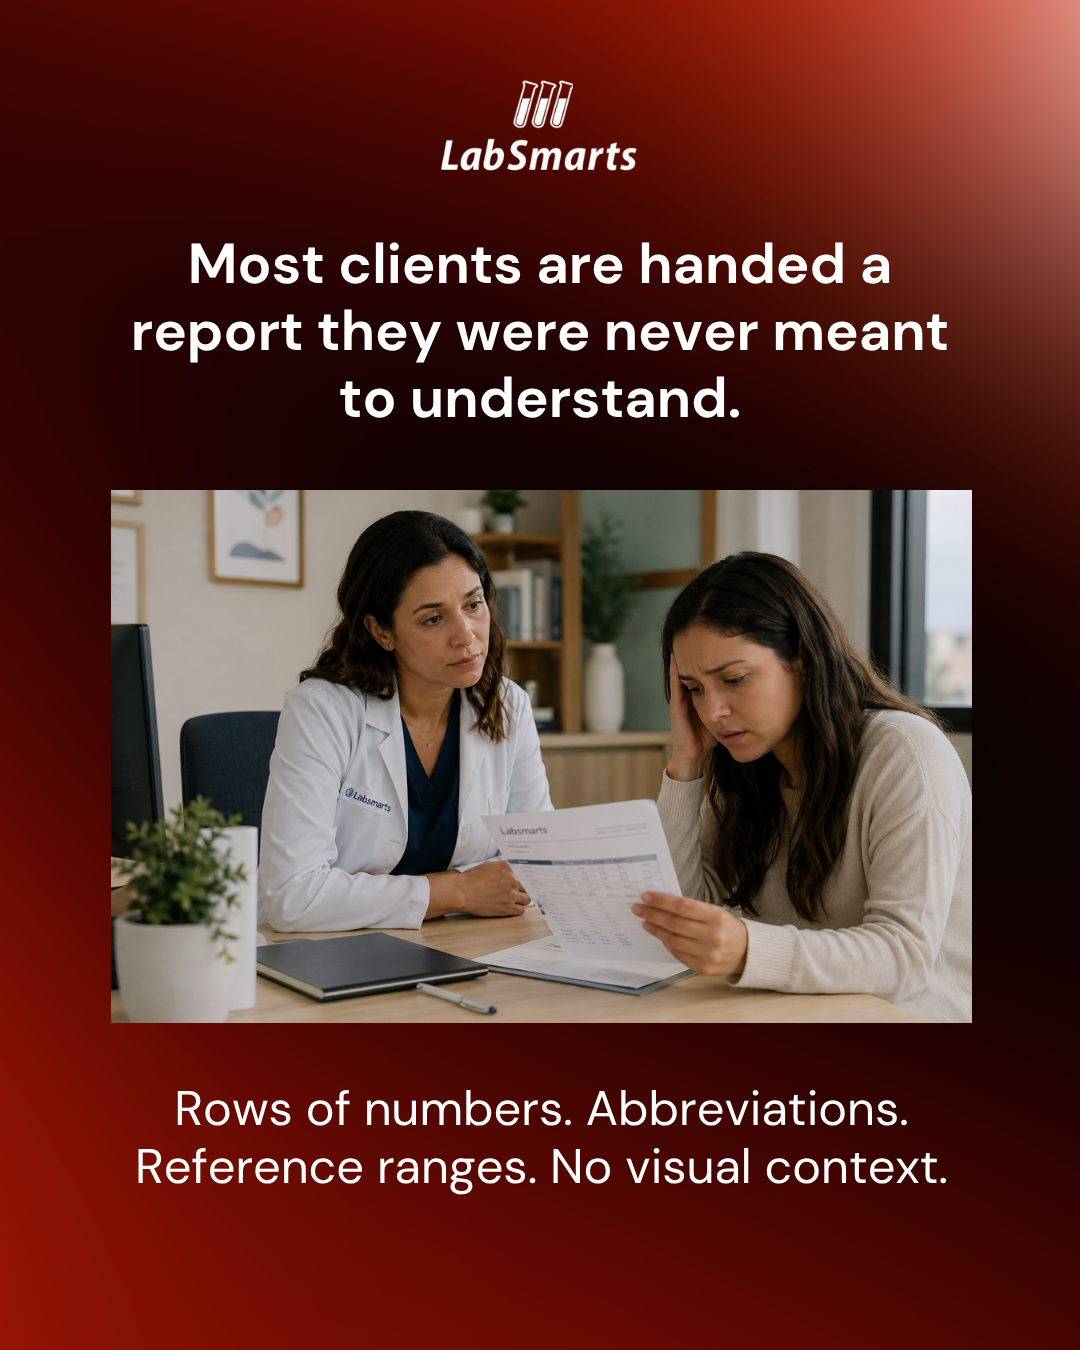
A standard lab report may contain valuable information, but it was not created for client education. It was created to report data. For many clients, that data shows up as rows of numbers, abbreviations, units, reference ranges, and high or low flags.
They may notice that something is flagged.
They may bring the report to the appointment with questions.
They may even feel concerned because they see a result outside the lab range.
But seeing a result is not the same as understanding it.
That is where the practitioner becomes the bridge between lab data and the bigger picture.
This is one of the main reasons I created LabSmarts. Practitioners already know how to review blood work. They need a better way to show clients what they are seeing.

Why Clients Struggle with Standard Lab Reports
Most standard lab reports are built for documentation. They communicate results in a consistent format, but they do not always help clients understand what those results mean.
A typical lab report includes marker names, numerical results, units of measurement, reference ranges, and high or low flags.
That format may be useful for practitioners, but for clients, it can feel like trying to read a spreadsheet in another language.
Clients often wonder:
- What does this marker mean?
- Why is this value flagged?
- Is this number okay?
- Why are we talking about something that is technically “normal”?
- Which results matter most?
The problem is not that clients do not care. Many of them care deeply.
The problem is that the report gives them data without helping them organize it.
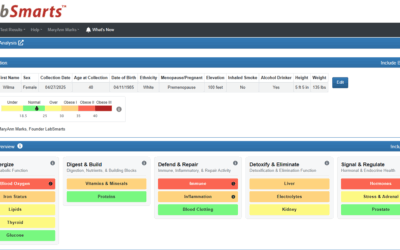
| Standard Lab Report | LabSmarts Visual Report |
| Rows of numbers | Color-coded visual ranges |
| High and low flags | Optimal-range context |
| Broad reference ranges | Bio-individual reference ranges |
| Isolated results | Pattern-based insights |
| Harder for clients to follow | Easier to explain in session |
Why Lab Reports Take So Much Time to Explain
If you review labs with clients, you know how much time can be spent simply translating the report.
You may explain what each marker means, why a result can be inside the lab range but still worth watching, or why one marker matters more when viewed alongside another.
That explanation is valuable, but it can take up a large part of the appointment.
Instead of moving straight into the bigger-picture conversation, you may spend time explaining the layout of the report, the meaning of the flags, and why standard lab ranges are not the only context you use.
This is especially true when the client is overwhelmed.
When someone is overwhelmed, they may nod along, but they are not always absorbing the information. A clearer report gives you a better starting point.
How Visual Reports Make Blood Work Easier to Explain
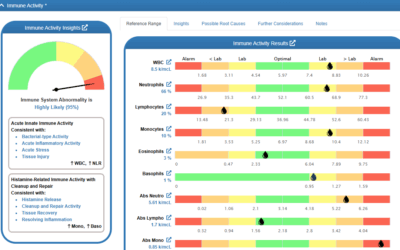
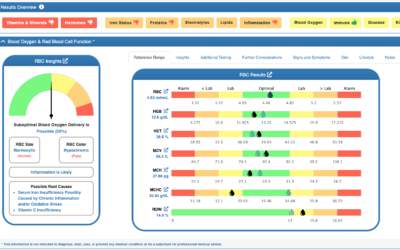
Visual reporting changes the conversation because it changes what the client sees.
Instead of only seeing a number in a column, the client can see where that value falls on a range. They can see whether it is below the lab range, below the optimal range, within the optimal range, above the optimal range, or above the lab range.
That visual context matters.
Many clients look at a standard report and assume that if nothing is flagged, everything must be fine. But practitioners know that blood work is not always that simple.
A value may still be worth discussing even when it is not flagged by the lab. Several values may be moving away from optimal. A group of related markers may tell a more useful story than one isolated result.
A visual lab report helps clients see what you are explaining.
It does not replace your interpretation. It makes your interpretation easier to communicate.

Why Bio-Individual Ranges and Patterns Matter
One limitation of standard lab reports is that reference ranges are broad.
They are useful, but they are not always personalized enough for functional blood chemistry analysis or nutrition-focused lab review.
LabSmarts uses bio-individual reference ranges to add more context to the review of blood work. Depending on the marker, LabSmarts may adjust ranges based on factors such as age, sex, pregnancy trimester, menstrual phase, pediatric considerations, and other relevant biological factors.
This matters because context changes interpretation.
A value that is expected in one person may deserve a different level of attention in another. Bio-individual reference ranges help bring that context into the report more clearly.
Pattern-based insights add another layer.
Clients are often trained to look for one thing on a lab report: what is high or low. But functional lab interpretation is more nuanced than that.
A marker may be within the lab range and still contribute to a pattern. A result may not mean much by itself but may become more meaningful when viewed alongside related markers.
The point is not to tell the client that one marker means one specific thing.
The point is to help them understand the broader pattern you are seeing.
How LabSmarts Helps Bridge the Gap
LabSmarts was built for practitioners who want a better way to review and explain blood work.
It turns standard lab results into visual, personalized, pattern-based reports using color-coded ranges, bio-individual reference ranges, section-based analysis, and client-friendly visuals.
The practitioner still brings the expertise.
LabSmarts simply helps present that expertise in a way clients can better understand.
Your clients are not just looking for lab data. They are looking to you to help them make sense of it.
When the report is clearer, the conversation is clearer.
And when the conversation is clearer, clients can better understand the value of the work you are already doing.