New LabSmarts Features: A Smarter Way to Review, Customize, and Share Blood Work
Blood work interpretation should be clear, organized, and clinically useful — not overwhelming.
That’s why we’ve added several new features designed to help practitioners interpret results faster, identify priorities more easily, and make client-facing reports more customizable.
This June 2026 update includes 8 major improvements:
- The LabSmarts 5-System Method™ (Results Overview Section)
- A systems-first way to review blood work through five functional body-system groups.
- Glucose Dysregulation Patterns
- A glucose dysregulation likelihood gauge with over 200+ metabolic imbalance patterns.
- Stress & Adrenal Balance Section
- A new section in the Signal & Regulate high-level group with markers that indicate adrenal function, such as Na/K ratio, cortisol, DHEA, and pregnenolone.
- Markers Outside Optimal Summary
- A cleaner PDF summary that organizes high and low markers by severity, direction, and physiological system.
- Floating Save Button
- A pinned save button that stays visible while entering or editing blood work data.
- Inline Client Editing
- A faster way to update client information directly from the blood work analysis view.
- Include / Hide PDF Section Controls
- More flexibility to customize what appears in each client-facing PDF report.
- BMI Bar Graph
- A new visual BMI graph on the dashboard and PDF, with age-appropriate display logic.
Together, these updates make LabSmarts easier to scan, explain, and tailor to each client.
Why This Update Matters
Practitioners do not need more disconnected lab data.
They need a clearer way to organize what they are seeing.
When you review a client’s blood work, you are trying to understand:
- Which body systems may need the most attention?
- Which markers are outside optimal?
- Which findings should be reviewed first?
- Which report sections should be included for this client?
- How can the results be explained clearly without overwhelming the client?
This update supports that entire workflow.
The new Results Overview helps you start with the bigger picture.
The Markers Outside Optimal summary helps you identify priorities faster.
The PDF controls help you customize the report.
The inline client editing and floating save button reduce workflow friction.
The BMI bar graph adds a clearer visual when BMI is appropriate to show.
The goal is simple: help practitioners spend less time hunting through lab data and more time interpreting blood work in a structured, useful, client-friendly way.
A Small Personal Note
This update brings together several things I have wanted to improve in LabSmarts for a long time.
Blood work interpretation is not just about identifying whether one marker is high or low.
It is about organizing the bigger picture.
It is about seeing patterns.
It is about knowing what deserves attention first.
It is also about creating a client-facing report that is clear enough to be useful without overwhelming the reader.
These new features support that process from several angles.
The LabSmarts 5-System Method™ helps practitioners start with high-level system groups.
The Markers Outside Optimal summary helps quickly surface priority markers.
The Glucose Dysregulation patterns help quickly identify metabolic imbalances.
The PDF controls make reports more flexible.
And the workflow updates make the entire process smoother.
This is the direction LabSmarts is moving: more organized, more visual, more clinically useful, and easier to explain.
Here’s What’s New in LabSmarts

1. The Results Overview Section
A systems-first way to interpret blood work
LabSmarts now organizes clinical sections into five functional body-system groups using The LabSmarts 5-System Method™.
This gives practitioners a faster way to review blood work at a glance and helps organize findings in a way that reflects the body’s interconnected system.
Instead of reviewing each section in isolation, you can now see how major systems are performing across the full report.
The 5 LabSmarts system-level groups are:
- Fuel Energy
- Energy & Metabolic Function
- Digest & Build
- Digestion, Nutrients, & Building Blocks
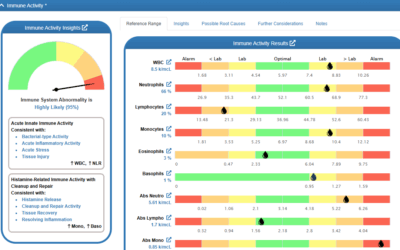
- Defend & Repair
- Immune, Inflammatory, & Repair Activity
- Detoxify & Eliminate
- Detoxification & Elimination Function
- Signal & Regulate
- Hormonal & Endocrine Health
Each system now appears as a color-coded status card on the Results Overview.
The most significant marker color within that system rises to the top, so practitioners can quickly identify which areas may need closer review.
The color progression follows the LabSmarts visual logic:
Green → Yellow → Orange → Red
This allows practitioners to scan the Results Overview and quickly see which systems appear stable, which may need fine-tuning, and which may need more focused attention.
Trend arrows also compare the current test to the previous one, helping practitioners see whether each system appears to be improving, worsening, or staying relatively stable over time.
This framework also carries into the PDF report, giving clients the same functional lens practitioners use during interpretation.
Why it matters: The LabSmarts 5-System Method™ helps practitioners start with the system, find the pattern, and then review the individual markers in context. This supports clearer pattern recognition, faster triage, and a more organized way to explain blood work to clients.

2. Glucose Dysregulation Gauge & Patterns
A quicker way to identify metabolic imbalance
The new glucose patterns inside LabSmarts help organize relationships between these key glucose markers:
- Glucose
- HbA1c
- Insulin
- C-peptide
- TG/HDL ratio
These patterns help provide context around blood sugar regulation, insulin response, pancreatic insulin output, lipid-related metabolic patterns, and, along with other markers, stress-influenced glucose changes, protein metabolism, acid load, and compensatory physiology.


3. Stress & Adrenal Balance Section
Grouping adrenal-related markers for faster review
Long blood work entry forms can require a lot of scrolling.
To make saving easier, LabSmarts now includes a floating save button that stays pinned to the bottom-right corner of the screen.
This means you no longer have to scroll all the way to the top or bottom of a long form just to save your work.
4. Markers Outside Optimal
A quicker way to review markers that need attention
The new Markers Outside Optimal (MOO) section provides practitioners and clients with a quicker way to review markers that may need closer attention.
Instead of searching the entire report for suboptimal results, the MOO section brings those markers together into an organized, scannable summary.

The layout separates markers into two columns:
- High markers on the left
- Low markers on the right
Markers are then organized by severity and direction:
- High/Low Alarm Range
- Needs attention
- Above / Below Lab Range
- Worth discussing
- Above / Below Optimal Range
- Fine-tune
Within each severity band, markers are grouped by physiological system to preserve clinical context.
This makes the MOO section especially helpful for triage.
The most urgent or clinically relevant findings rise to the top, while less severe optimal-range deviations remain visible without overwhelming the report.
Long lists paginate automatically, and section headers repeat with “cont.” on spillover pages so nothing gets cut off or lost.
Why it matters: For practitioners, this creates a faster review process. For clients, it creates a more approachable summary they can understand at a glance. The MOO section helps answer one of the most common questions in a blood work review:
“What needs attention first?”

5. Floating Save Button
A smoother workflow for longer blood work entry forms
Long blood work entry forms can require a lot of scrolling.
To make saving easier, LabSmarts now includes a floating save button that stays pinned to the bottom-right corner of the screen.
This means you no longer have to scroll all the way to the bottom to save your work.
The button is:
- Always visible while entering or editing blood work data
- Positioned in the bottom-right corner
- Styled in the LabSmarts warm neutral brand tone
- Designed with a subtle shadow so it remains easy to find without feeling distracting
This small update creates a smoother, more consistent workflow and saves time, especially when editing a test.
It also mirrors the floating arrow-up button on the analysis view, giving the LabSmarts blood work workflow a more consistent action surface throughout the platform.
Why it matters: The floating save button reduces unnecessary scrolling and makes saving feel more intuitive while working through larger panels. Small workflow improvements like this can make a big difference when practitioners are reviewing multiple clients or entering detailed lab data.
6. Edit Client Info Directly in Test Results
Update client context without leaving the blood work analysis view
You can now edit client information directly from the blood work analysis view.
Previously, if you noticed that a client’s demographic information needed to be updated, you had to leave the test, go back to the client profile, make the change, and then return to the analysis.
Now, the Client Information card includes an inline Edit button.
From the test itself, you can update key client details, including:

- Last Name
- First Name
- Sex
- Date of Birth
- Ethnicity
- Menopausal Status
- Pregnancy Trimester
- Elevation
- Inhaled Smoke Status
- Alcohol Drinker Status
- Height
- Weight
This is especially important because several LabSmarts reference ranges depend on demographic and physiologic context, including age, sex, pregnancy status, elevation, and other client-specific factors.
When updated client information is saved, any affected reference ranges automatically recalculate against the new values.
This helps keep the interpretation aligned with the client’s actual context without interrupting your workflow.
For team-based practices, access is permission-based, so practices can control who is allowed to edit client data.
Why it matters: This keeps the client’s information more organized and makes it easier to consider the full picture while reviewing current results and comparing them to past results.

7. Include/Hide Sections in PDF Report
More control over what appears in client-facing reports
- Results Overview
- Markers Outside Optimal
- Clinical Sections
- BMI
This gives practitioners more flexibility depending on the client, visit type, report purpose, or level of detail they want to provide.
For example, you may want to send a streamlined first-visit report for one client, while exporting a more complete deep-dive report with supplements for another.
No manual PDF editing required.
Two Levels of PDF Control
There are now two ways to control what appears in the PDF.
Persistent Defaults
On the Settings page, you can set your standard PDF template once.
These preferences become your default for future PDF exports.
This is helpful if you usually include or exclude certain sections in your reports.
Per-Test Overrides
On the analysis view, each section includes an inline Include in PDF checkbox.
This lets you override your default settings for the specific test you are working on without changing your saved template.
So your standard PDF structure stays intact, while still giving you flexibility when an individual report needs something different.
Why it matters: Practitioners do not always need the same PDF structure for every client. The new PDF controls make LabSmarts more flexible, allowing you to create a report that fits the client, the visit, and the purpose of the review.
8. New BMI Bar Graph
A clearer visual display when BMI is appropriate to show
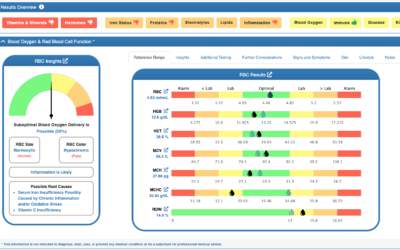
LabSmarts now includes a BMI bar graph on both the analysis dashboard and the PDF report.
The new visual uses a horizontal bar with color-coded zones and a small water-drop marker that shows exactly where the client’s BMI falls on the scale.
For adults age 20 and older, the graph uses standard BMI categories:
The button is:
- Underweight
- Normal
- Overweight
- Obese Class I
- Obese Class II
- Obese Class III


For children and teens ages 2–19, the graph uses age- and sex-specific BMI percentiles:
- Underweight: below the 5th percentile
- Healthy Weight: 5th to less than the 85th percentile
- Overweight: 85th to less than 95th percentile
- Obese: 95th percentile or higher
A built-in tooltip explains which reference system is being used, so practitioners and clients understand how the BMI category was determined.
This gives BMI a clearer visual context while still recognizing that BMI interpretation varies with age.
For children under age 2, BMI is hidden because weight-for-length is the recommended growth assessment at that age.
Why it matters:
BMI can be difficult to interpret clearly when it is presented only as a number. The new BMI bar graph provides visual context while still applying age-appropriate display logic. It helps make BMI easier to understand when it is relevant and keeps it hidden when it is not the appropriate measure.
Designed to Make Blood Work Easier to Review and Explain
These new features are part of a larger LabSmarts goal: to make blood work interpretation more organized, more visual, and more useful in real-world practice.
- The LabSmarts 5-System Method™ helps practitioners see the bigger picture.
- The Glucose Dysregulation likelihood gauge and patterns easily identify metabolic imbalances.
- The Stress & Adrenal Balance section quickly points out adrenal dysfunction.
- The Markers Outside Optimal section helps identify priorities faster.
- The PDF controls help practitioners customize the client-facing report.
- The floating save button and inline client editing reduce workflow friction.
- The BMI bar graph adds a clearer visual layer when BMI is appropriate to show.
Together, these updates make LabSmarts more flexible for practitioners and easier for clients to understand.
A Better Way to Move From Labs to Insight
Blood work is full of details.
LabSmarts helps organize those details into a functional, visual, and clinically useful format so practitioners can spend less time hunting through data and more time helping clients understand what their results may be showing.
This update supports the full blood work review process:
- Start with the system.
- Find the pattern.
- Identify the priorities.
- Customize the report.
- Explain the results with more clarity.
That is the direction LabSmarts is moving.
More organized.
More visual.
More practical.
More useful for the way practitioners actually review blood work.
Built Around Real Practitioner Workflow
These updates were created to make LabSmarts easier to use in the way practitioners actually review, interpret, and explain blood work.
From reviewing a report, to identifying key findings, to comparing follow-up results, each improvement is designed to make blood work interpretation faster, clearer, and more useful in real client conversations.
Ready to Explore the Updates?
If you already have a LabSmarts account, log in and open a client report to explore the new June 2026 features.
Start with the Results Overview and review the five system-level cards.
Then look at the new Markers Outside Optimal summary.
Try the PDF section controls.
Notice how the floating save button and inline client editing make the workflow smoother.
These updates were designed to help you review blood work with more clarity, customize reports with more flexibility, and create a better experience for both you and your clients.
If you are new to LabSmarts, you can create a free account and see how LabSmarts helps turn complex blood work into clearer, more organized, bio-individual insights.