What’s New in LabSmarts
A faster, clearer way to move through your client’s blood work
The newest LabSmarts updates were built around real-practitioner workflow, helping you review reports faster, compare follow-up labs more clearly, and keep the client’s bigger picture connected over time.
Why These Updates Matter
When you are reviewing a client’s blood work, you are not just looking at isolated numbers.
You are trying to quickly understand:
- Where should I focus first?
- Which sections need the most attention?
- What has changed since the last test?
- Where does the client appear to be improving?
- How do I summarize the bigger picture clearly?
- These updates were created to make those questions easier to answer.
What’s New at a Glance
In this update, LabSmarts now includes:
- New Results Overview panel so you can quickly see which sections need attention
- Faster navigation between report sections
- Improvement indicators to help track client progress
- Multiple report insights all in one place
- Cleaner client intake fields
- Height, weight, and BMI tracking
- Automatic eGFR calculation
- Expanded PDF upload support
- Hide sections in client reports
A Small Personal Note
At NANP’s HEALCon this year, I was honored to receive the H.E.A.L. Award, which recognizes the Highest Exceptional Achievement or Lifetime contribution in the holistic nutrition profession.
This recognition means so much to me because it came from a community I care deeply about, and one I have been building LabSmarts to support from the beginning.
Your feedback, questions, and real-world use of the software continue to shape what LabSmarts becomes.
These newest updates are part of that ongoing work.

Here’s What’s New in LabSmarts
Here’s a closer look at what’s new and how each update is designed to make LabSmarts easier to use in your day-to-day workflow.

A New Results Overview Panel
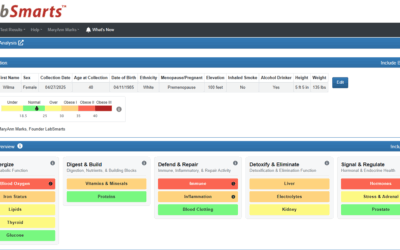
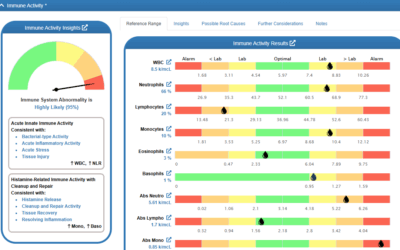
LabSmarts now includes a color-coded Results Overview panel at the top of each analysis report. This gives you a quick visual summary of each section, including whether markers are all optimal, outside optimal, outside the lab range, or in the alarm range.
Each section appears as a clickable button, giving you a faster way to understand the report before reviewing each marker in detail.
Why it matters: You can now get a high-level view of the report before reviewing each section in detail. This makes it easier to quickly identify which areas may need closer attention.

Easier Navigation
Each button in the Results Overview panel lets you jump directly to that section.
There is also a gray arrow button in the lower-right corner of the screen that returns you to the Results Overview at any time.
Why it matters: Instead of scrolling through the entire report, you can jump directly to the sections you want to review first. This helps make report review faster and more organized.

Improvement Indicators
When comparing two tests in the Test Results Analysis report, LabSmarts now shows a green thumbs-up or red thumbs-down icon in the Results Overview buttons.
These indicators help you quickly see which sections appear to be moving closer to optimal or further away from optimal between two test results.
Why it matters: This makes it easier to track progress at a section level over time and have more meaningful follow-up conversations with clients. You can quickly see which body systems and processes are moving in the right direction and where additional support may still be needed.

All Client Insights in One Place
The notes you save in the Insights section at the bottom of any test results analysis report now appear at the bottom of the comparison table. You can choose to print save to the comparison table PDF.
This allows notes from multiple tests for the same client to stay connected in one place.
Why it matters: This keeps the client’s information more organized and makes it easier to consider the full picture while reviewing current results and comparing them to past results.

Summarize Progress and Trends Across Multiple Tests
There is now an open text field called Overall Progress and Trends at the end of the comparison table for each client.
You can use this field to summarize the client’s overall progress, key trends, or meaningful changes across multiple tests and include it in their PDF.
Why it matters: You now have a dedicated place to document the client’s story across time.

Cleaner Client Intake Fields
The previous Cigarette Smoking field is now Inhaled Smoke, which better reflects regular smoke exposure from combusted sources such as cigarettes, cannabis, cigars, hookah, or wood and fire smoke.
The Alcohol Drinker field is also simplified to yes or no.
Why it matters: The intake is cleaner and more aligned with how LabSmarts uses these fields for relevant pattern context.

** US and SI are not related to the units of the markers. Markers can only be entered in US units. But this is a building block for that future work.
Height, Weight, and BMI
LabSmarts now collects height and weight in both the Add Client and Add Test Results forms and automatically calculates BMI based on the values entered.
Height is used for the new automated pediatric eGFR calculation described in a new feature section below.
A new Units toggle lets you choose US or SI, so height and weight are entered and displayed in the units you use day to day.
** US and SI are not related to the units of the markers. Markers can only be entered in US units. But this is a building block for that future work.
When you select a client in Add Test Results, their saved height and weight populate automatically as the defaults for that test. If the client’s body composition has changed since their last visit, you can update the height and weight directly on the test entry form without leaving the test entry form to edit the client record first.
Those updated values are automatically saved back to the client record, so they appear as the new defaults in the Clients table, in the Client Info panel of the Test Results Analysis, and on the next test entry.
You can still update height and weight through the Edit Client feature at any time.
Why it matters: Cleaner intake information helps support more personalized, bio-individual blood work interpretation. It also makes the client profile easier to review and update over time. BMI is automatically calculated, giving you another data point for bio-individual interpretation alongside the rest of the client’s pattern.
And P.S., we will be using BMI to define bio-individual ranges for the new Lipase marker we’ll be adding soon.
Automatic eGFR calculation
LabSmarts now calculates an estimated Glomerular Filtration Rate (eGFR) automatically whenever creatinine is present and the client’s profile is complete, so you no longer have to enter it manually or work around lab reports that simply say “greater than 90.”
The calculation uses current, validated equations based on the client’s age at the time of the blood draw:
- For clients 18 and older, LabSmarts uses the CKD-EPI 2021 equation, the race-free formula recommended by the National Kidney Foundation and ASN Task Force.
- For clients under 18, LabSmarts uses the Bedside Schwartz 2009 equation, which requires height. If height is not on the client profile or the test entry, the eGFR field will stay blank, and you can enter height or the eGFR value manually.
If your lab report already includes a numeric eGFR value, it is retained and displayed exactly as it appears on the report. The auto-calculation only activates when no numeric value is present.
When a lab reports “>90” or “>60” instead of a precise number, LabSmarts now resolves the actual value using the appropriate formula and stores that number instead of the placeholder.
The calculation runs at analysis time and uses the client’s age on the collection date rather than their current age, which keeps longitudinal comparisons accurate even when you are reviewing tests from earlier years.
Formulas Used
| Age | Formula |
| < 18 | Bedside Schwartz (2009) 0.413 × height(cm) / Creatinine |
≥ 18 Female | CKD-EPI (2021) 142 × min(Creatinine/0.7,1)^−0.241 × max(Creatinine/0.7,1)^−1.2 × 0.9938^Age × 1.012 |
≥ 18 Male | CKD-EPI (2021) 142 × min(Creatinine/0.9,1)^−0.302 × max(Creatinine/0.9,1)^−1.2 × 0.9938^Age × 1.0 |
CKD-EPI 2021 is the race-free equation adopted in accordance with the NKF-ASN Task Force recommendation (AJKD 2021).
Formulas Used
| Age | Formula | Key Inputs | Reference |
| < 18 | Bedside Schwartz (2009) 0.413 × height(cm) / Scr | Height, Creatinine (Scr) | Schwartz et al., JASN 2009 |
| ≥ 18 (Female) | CKD-EPI (2021) 142 × min(Scr/0.7,1)^−0.241 × max(Scr/0.7,1)^−1.2 × 0.9938^Age × 1.012 | Creatinine (Scr), Age | Inker et al., NEJM 2021 |
≥ 18 (Male) | CKD-EPI (2021) 142 × min(Scr/0.9,1)^−0.302 × max(Scr/0.9,1)^−1.2 × 0.9938^Age × 1.0 | Creatinine (Scr), Age | Inker et al., NEJM 2021 |
CKD-EPI 2021 is the race-free equation adopted in accordance with the NKF-ASN Task Force recommendation (AJKD 2021).
Why it matters: eGFR is commonly included on lab reports, but when it is missing, LabSmarts can now calculate it to support a more complete kidney function review.


More PDF Upload Support
LabSmarts now supports PDF uploads for:
- Northwestern HealthLab
- Clinical Pathology Laboratories, CPL
Why it matters: More supported lab sources means more flexibility and less manual data entry when those PDFs can be uploaded directly.

Hide Sections from Online Reports & PDFs
LabSmarts now lets you hide any analysis section from the online report. When a section is hidden, it will also be excluded from the client PDF.
This gives you more control over each report, so you can keep the final PDF focused on the sections that are most relevant for that client.
Why it matters: This gives you more control over what appears in each client report, so you can keep the final PDF focused on the sections that are most relevant for that client.
Built Around Real Practitioner Workflow
These updates were created to make LabSmarts easier to use in the way practitioners actually review, interpret, and explain blood work.
From reviewing a report, to identifying key findings, to comparing follow-up results, each improvement is designed to make blood work interpretation faster, clearer, and more useful in real client conversations.
Ready to Explore the Updates?
These new features were built to make blood work interpretation faster, clearer, and easier to use in your day-to-day workflow.
If you already have a LabSmarts account, log in and open a client report to explore the new Results Overview panel, easier navigation, improvement indicators, follow-up tools, and updated intake fields.
If you are new to LabSmarts, create your free account and see how LabSmarts helps turn complex blood work into clear, personalized insights.