What’s New • November 2026
See How Every Marker Moves Over Time
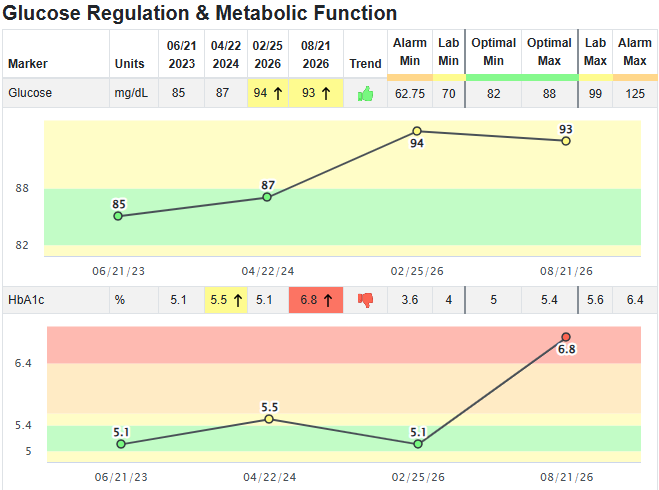
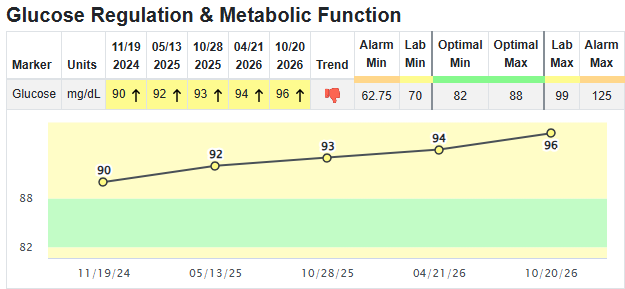
When a client’s fasting glucose creeps up a few points at every draw, the trend tells you something. Until now, you had to read it across a row of numbers.
On November 12, 2026, we released trend charts in LabSmarts, along with 9 new NMR LipoProfile markers, VLDL cholesterol, and two more upload formats. Here’s what’s new and how to use it.
Trend charts in your comparison tables
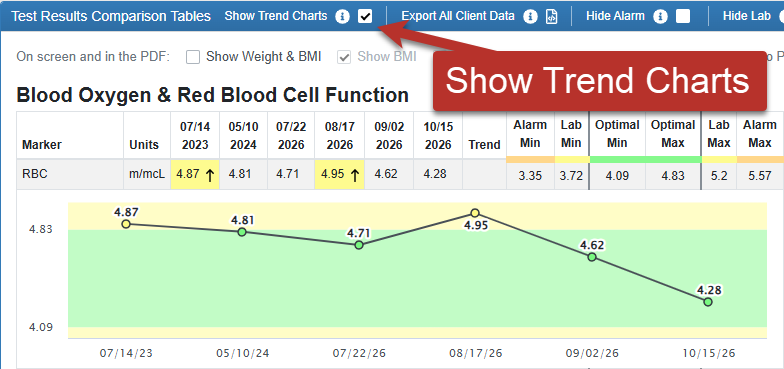
Check Show Trend Charts in the comparison title bar. Every marker with two or more results gets a line graph right under it. This applies to every section, including your custom markers and the Weight & BMI table.
Each chart is shaded with the marker’s optimal, lab, and alarm ranges when applicable, and each result is colored the same way the table colors it.
You’ll see when a result moved out of optimal and when it came back.
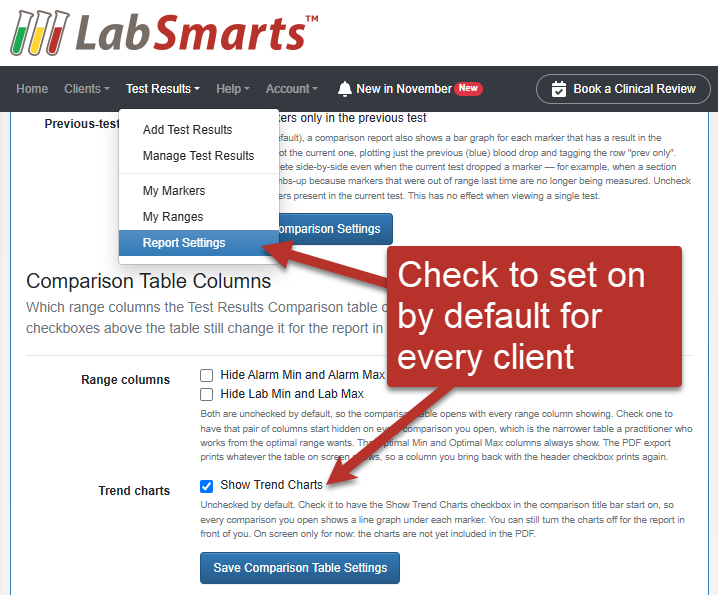
Want the charts on all the time? Turn on Show Trend Charts under Comparison Table Columns in Report Settings.
Choose which tests to compare
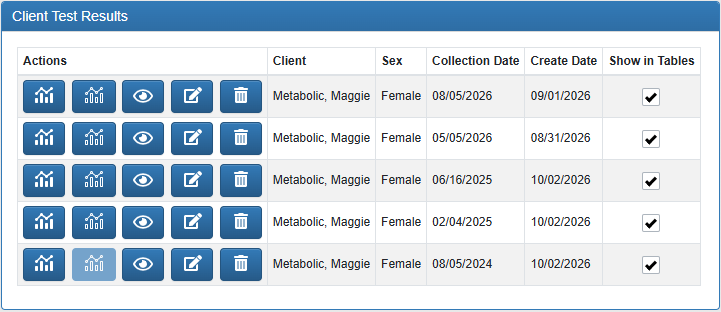
In Client Test Results, there’s a new Show in Tables checkbox beside each test. Every test starts checked, so uncheck any you’d rather leave out (a non-fasting retest, for example). The tables now show up to 20 tests instead of 10, and the PDF prints the five most recent tests you leave checked.
NMR LipoProfile markers
Nine advanced lipid markers now chart in Lipid Balance and appear in the comparison table: LDL-P, HDL-P, Small LDL-P, LDL Size, Large VLDL-P, Large HDL-P, VLDL Size, HDL Size, and the LP-IR Score. Each range is built from the percentile ladder printed on the NMR report.
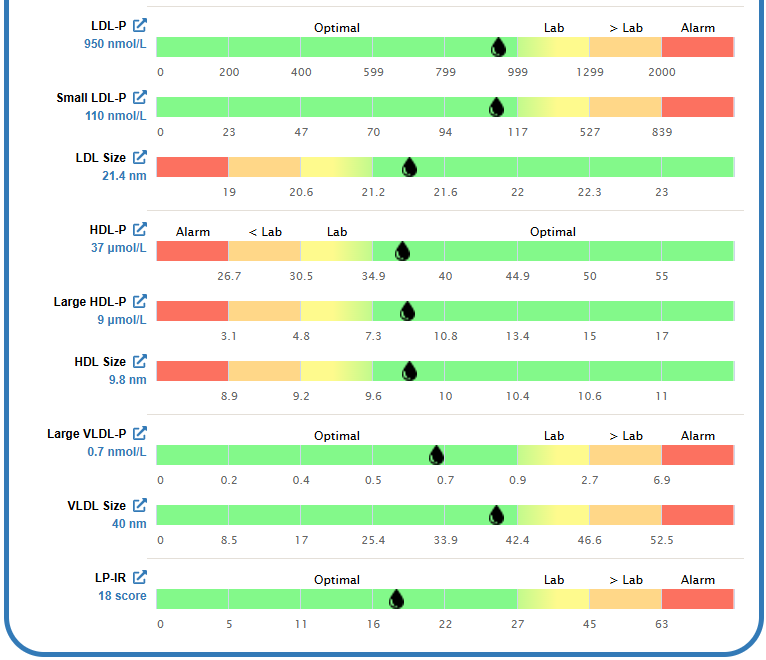
LabSmarts groups the NMR markers by particle type: the LDL particle markers sit together, then HDL, then VLDL, with the LP-IR Score last. You can read everything about one type of particle in one place, instead of hunting for it across the Labcorp report.
LDL cholesterol and LDL particle number don’t always agree. When they don’t, it’s worth a closer look, and now you can see both side by side.
Upload an NMR LipoProfile report and all nine particle markers fill in automatically. One thing to know: this reads NMR panels only. Ion mobility panels, like Quest Cardio IQ, measure the same particles on a different scale, so those results won’t fill these fields.
VLDL cholesterol
VLDL now charts in Lipid Balance with the rest of the lipid panel and shows up in the comparison table. If the lab prints it, LabSmarts reads it from the report. If the lab doesn’t, LabSmarts calculates it from total cholesterol, HDL, and LDL.
Two more PDF upload formats
Boston Heart and Texas Physician Associates PDFs now upload and fill in automatically.
You don’t need to do anything to get these. They’re live in your account now. Log in, open a client with two or more tests, and check Show Trend Charts.